Market Outlook
October 27, 2016
Market Cues
Domestic Indices
Chg (%)
(Pts)
(Close)
Indian markets are likely to negative tracking global cues and SGX Nifty.
BSE Sensex
(0.9)
(255)
27,837
Nifty
(0.9)
(76)
8,615
U.S. indices had a mixed session on Wednesday as a number of earning results
came in. Apple Inc. (AAPL) fell by 2.2% after it released a mixed earnings report.
Mid Cap
(0.9)
(122)
13,421
Home-improvement retailer Lowe's Cos. Inc. fell 1.6% after it was hit with two
Small Cap
(0.7)
(90)
13,429
downgrades. New home sales rose in September, though the increase was helped
Bankex
(1.9)
(432)
22,347
by revisions to the previous month’s data.
UK’s FTSE index lost its previous day’s gains as commodity prices slumped with
Global Indices
Chg (%)
(Pts)
(Close)
crude prices falling below $49. Antofagasta dropped 3.15% after the company
Dow Jones
0.2
30
18,199
guided toward a lower copper output range in 2017. Royal Bank of Scotland Group
finished higher by 0.73 percent after Clydesdale made a preliminary non-binding
Nasdaq
(0.6)
(33)
5,250
proposal to buy its Williams & Glyn operations.
FTSE
(0.8)
(60)
6,958
Indian indices lost ground for another session as weakness in Tata group stocks
Nikkei
0.2
27
17,392
pulled down the broader indices lower. Tata Group stocks remained under pressure,
Hang Seng
(1.0)
(240)
23,325
with Tata Motors and Tata Steel losing about 5 percent each. Axis bank fell by 8.3%
Shanghai Com
(0.5)
(16)
3,116
after it reported an 83% decline QoQ in profits for Q2FY17.
Advances / Declines
BSE
NSE
Result Review, Preview & News Analysis
Advances
1,148
542
Result Review: Cadilla Healthcare, Indoco Remedies
Declines
1,647
1,099
Result Preview: Tech Mahindra
Hero Motocorp Q2FY17 Results
Unchanged
237
67
Update to Cyrus Mistry’s resignation from Tata Sons
Detailed analysis on Pg2
Volumes (` Cr)
BSE
3,598
Investor’s Ready Reckoner
NSE
22,790
Key Domestic & Global Indicators
Stock Watch: Latest investment recommendations on 150+ stocks
Net Inflows (` Cr)
Net
Mtd
Ytd
Refer Pg6 onwards
FII
(505)
(1,501)
48,504
Top Picks
MFs
729
6,016
19,963
CMP
Target
Upside
Company
Sector
Rating
(`)
(`)
(%)
Amara Raja Batteries Auto & Auto Ancill.
Buy
1,017
1,218
19.7
Top Gainers
Price (`)
Chg (%)
HCL Tech
IT
Buy
791
1,000
26.5
Ttkprestig
6,094
5.2
Bharat Electronics
Capital Goods
Accumulate
1,259
1,414
12.3
Gmrinfra
14
5.2
Equitas Holdings
Financials
Buy
177
235
33.1
Piind
867
4.6
Navkar Corporation Others
Buy
196
265
35.2
More Top Picks on Pg6
Gati
145
4.6
Idea
79
4.4
Key Upcoming Events
Previous
Consensus
Date
Region
Event Description
Reading
Expectations
Top Losers
Price (`)
Chg (%)
Oct 27 UK
GDP (YoY)
2.1
2.1
Axisbank
487
(8.0)
Oct 27 US
Initial Jobless claims
260.0
--
Jublfood
1,059
(7.5)
Oct 28 Euro Zone
Euro Zone Consumer Confidence
(8.0)
(8.0)
Carerating
1,430
(5.9)
Oct 28 UK
PMI Manufacturing
55.4
--
Oct 31 US
GDP QoQ (Annualised)
1.4
2.5
Cadilahc
388
(4.8)
6.(
More Events on Pg7
Jswenergy
67
(4.4)
As on October 26, 2016
Market Outlook
October 27, 2016
Result Review
Cadila Healthcare (CMP: `408 / TP: /Upside:)
Cadila Healthcare, posted results lower than expected on net profit and sales
front. In rupee terms, the consolidated revenues; came in at `2,336cr V/s
`2,373cr expected, down 1.6% yoy, mainly driven by pressure on the US generic
market.
The Formulation business sales (`1,988cr, up 3.2% yoy), mainly lead by the
US(`988.8cr, 1.5% dip yoy), Indian Formulation ( `820.9cr, a yoy growth 8.8%),
Emerging market Formulations (`113cr, a yoy dip of 3.2%) and Latin America
formulations ( `65.6cr, a yoy growth of 24.6%) . The other Business & Alliances (
`398.5cr), a yoy growth of 4.0%. Europe Formulations (`55.7cr, a yoy dip of
14.1%), Consumer Wellness (`111.9cr, a 7.6% yoy growth), Animal Healthcare
(`122.5cr, a yoy growth of 51.9%), API (`83.2cr, a yoy dip of 7.4%) and Alliances
(`25.2cr, a yoy dip of 42.5%).
On operating front, the EBITDA margins came in at 21.4% V/s 21.7% expected V/s
22.6% in 2QFY2016. Consequently, Adj. PAT came in at `336.2cr V/s `460.7cr
expected V/s `390.9cr in 2QFY2016, yoy de-growth of 14.0%. Other reason in
the dip in the net profit was the `40.4cr V/s `109.4cr, a yoy dip of 63.1%. We
maintain our neutral rating on the stock.
Y/E
Sales OPM
PAT
EPS ROE P/E P/BV EV/EBITDA EV/Sales
March
(` cr)
(%)
(` cr)
(`)
(%)
(x)
(x)
(x)
(x)
FY2017E
11,126
22.0
1,750
17.1
15.7
22.7
5.8
16.0
3.5
FY2018E
13,148
22.0
2,044
20.0
17.1
19.4
4.6
13.1
2.9
Indoco Remedies (CMP: `297 / TP:`225 /Upside:-24.2%)
Indoco Remedies, posted sales of `276cr V/s `248cr up by 11.6% yoy, mainly on
back of domestic sales (`168.8cr, which grew by 22.0% yoy). Overall, the
formulations, which posted sales of `261.4cr, grew by 13.0% yoy. The API
(`135.9cr) posted a sales dip of 11.0% yoy. On operating front, the gross margins
are expected to come in at 64.9% (65.0% expected) V/s 64.4% in 2QFY2016, with
EBIDTA margins coming in at 13.5% (15.5% expected) V/s 15.5% in 2QFY2016.
Consequently, PAT came in at `22.1cr V/s `22.6cr, a yoy dip of 2.2%. This was
against, the expectations of `25cr. We maintain our SELL rating on the stock.
Y/E
Sales OPM
PAT
EPS ROE P/E P/BV EV/EBITDA EV/Sales
March
(` cr)
(%)
(` cr)
(`)
(%)
(x)
(x)
(x)
(x)
FY2017E
1,112
18.2
122
13.2
19.2
22.4
4.0
14.1
2.6
FY2018E
1,289
18.2
144
15.6
19.2
19.0
3.4
11.8
2.1
Market Outlook
October 27, 2016
Result Preview
Tech Mahindra (CMP: `425 / TP:`700 /Upside:64.7%)
Tech Mahindra, is expected to post sales of US$106mn V/s US$103mn in
1QFY2017, registering a qoq growth of 2.9%. In INR terms, the company posted a
`7,068cr V/s `6,921cr, a qoq growth of 2.1%. On EBIDTA margins are expected
to come in at 14.6% V/s 14.9% in 1QFY2017. Consequently, PAT is expected to
came in at `755cr V/s `750cr in 1QFY2017, a qoq growth of 0.6%.We maintain
our buy rating on the stock.
Y/E
Sales OPM
PAT
EPS ROE P/E P/BV EV/EBITDA EV/Sales
March
(`cr)
(%)
(`cr)
(`)
(%)
(x)
(x)
(x)
(x)
FY2017E
29,673
17.0
3,559
36.8
21.5
11.6
2.5
7.0
1.2
FY2018E
32,937
17.0
3,917
40.5
20.5
10.5
2.2
5.9
1.0
News Analysis
Hero Motorcorp Q2FY17 results
Hero Motocorp reported 14.5% YoY growth in its sales to `7,796cr. PAT came in
at `1,004cr, up 28% over lower input costs. EBITDA was at `1,369cr , up 25% YoY
and margins were at 16.2%, vs. 14.9% in Q2FY16. During the quarter, company
sold total 18.23 lakh vehicles, 15.8% more than vehicles sold in Q2FY16.
During the quarter, net realizations were down 1.4% YoY to `42,059 per unit. On
QoQ basis however net realizations have gone up by 1%. Input costs (COGs) at
`28,425, down 4.1% YoY which helped to improve its profitability. The earnings
per share for the quarter was at `50.29. We see further scope of improvement in
the business over the strong results.
Update to Cyrus Mistry’s resignation from Tata Sons
Yesterday, Cyrus Mistry in a communication to the Tata Sons board and Tata
trustees made a number of serious assertions regarding the financial and
operational performance of the group as well as group companies. In the
communication he asserted that he was a turned into a “lame duck” chairman as
he did not have the independence to make decisions to execute his responsibilities
effectively. In the letter, Mr. Mistry also stated that his removal from the post was
“illegal”.
This letter goes on to make specific accusations which if true could have a strong
impact on the group’s performance going forward. We are of the view that these
developments would put a pressure on the stock for the short to medium term.
Market Outlook
October 27, 2016
Quarterly Bloomberg Brokers Consensus Estimate
Bajaj Finance Ltd - Oct 27, 2016
Particulars ( ` cr)
2QFY17E
2QFY16
y-o-y (%)
1QFY17
q-o-q (%)
PAT
408
279
46.2
424
(3.8)
Maruti Suzuki India Ltd - Oct 27, 2016
Particulars ( ` cr)
2QFY17E
2QFY16
y-o-y (%)
1QFY17
q-o-q (%)
Net sales
15,211
13,575
12.1
14,655
3.8
EBITDA
2,215
2,269
(2.4)
2,216
(0.0)
EBITDA margin (%)
14.6
16.7
15.1
Net profit
1,229
1,226
0.3
1,486
(17.3)
Oil & Natural Gas Corp Ltd - Oct 27, 2016
Particulars ( ` cr)
2QFY17E
2QFY16
y-o-y (%)
1QFY17
q-o-q (%)
Net sales
18,333
20,563
(10.8)
17,670
3.7
EBITDA
8,476
8,775
(3.4)
8,430
0.5
EBITDA margin (%)
46.2
42.7
47.7
Net profit
3,646
4,842
(24.7)
4,233
(13.9)
Tech Mahindra Ltd Consol - Oct 27, 2016
Particulars ( ` cr)
2QFY17E
2QFY16
y-o-y (%)
1QFY17
q-o-q (%)
Net sales
6,895
6,616
4.2
6,921
(0.4)
EBITDA
1,092
1,101
(0.8)
1,029
6.1
EBITDA margin (%)
15.8
16.6
14.9
Net profit
726
786
(7.6)
750
(3.3)
JSW Steel Ltd Consol - Oct 27, 2016
Particulars ( ` cr)
2QFY17E
2QFY16
y-o-y (%)
1QFY17
q-o-q (%)
Net sales
12,429
10,743
15.7
12,720
(2.3)
EBITDA
2,664
1,729
54.1
3,269
(18.5)
EBITDA margin (%)
21.4
16.1
25.7
Net profit
760
117
549.9
1,109
(31.5)
Glenmark Pharmaceuticals Ltd consol - Oct 27, 2016
Particulars ( ` cr)
2QFY17E
2QFY16
y-o-y (%)
1QFY17
q-o-q (%)
Net sales
1,979
1,895
4.4
1,883
5.1
EBITDA
404
402
0.5
379
6.6
EBITDA margin (%)
20.4
21.2
20.1
Net profit
223
200
11.4
218
2.3
United Spirits Ltd - Oct 27, 2016
Particulars ( ` cr)
2QFY17E
2QFY16
y-o-y (%)
1QFY17
q-o-q (%)
Net sales
2,263
2,122
6.6
2,027
11.6
EBITDA
211
318
(33.4)
198
6.5
EBITDA margin (%)
9.3
15.0
9.8
Net profit
74
1,729
(95.7)
30
150.5
Market Outlook
October 27, 2016
India Oil Corp Ltd - Oct 27, 2016
Particulars ( ` cr)
2QFY17E
2QFY16
y-o-y (%)
1QFY17
q-o-q (%)
Net sales
94,037
85,115
10.5
85,655
9.8
EBITDA
8,960
695
1,189.4
13,684
(34.5)
EBITDA margin (%)
9.5
0.8
16.0
Net profit
4,214
97
4,246.9
8,269
(49.0)
ABB India Ltd - Oct 27, 2016
Particulars ( ` cr)
3QCY16E
3QCY15
y-o-y (%)
2QCY16
q-o-q (%)
Net sales
2,073
1,940
6.9
2,074
(0.0)
EBITDA
162
156
3.8
170
(4.6)
EBITDA margin (%)
7.8
8.0
8.2
Net profit
75
59
27.2
77
(3.5)
Economic and Political News
Centre to announce 2% dearness allowance for govt. employees and
pensioners
Government to plan Market Intervention Scheme (MIS) for arecanut
Cabinet to consider advancing Budget to Feb 1
Corporate News
Sun Pharma buys eye care specialist Ocular Tech for $40m
Dr Reddy's Laboratories enters into collaboration with Gland Pharma to
market and distribute 8 Abbreviated New Drug Applications (ANDAs)
Suzlon forms Joint Venture with Ostro Energy for 50-mw solar project
Market Outlook
October 27, 2016
Top Picks
Large Cap
M
arket Cap
CM
P
T
arget
Upsid
e
Company
Rationale
(` Cr)
(`)
(`)
(%)
To outpace battery industry growth due to better technological
Amara Raja Batteries
17,379
1,017
1,218
19.7
products leading to market share gains in both the
automotive OEM and replacement segments.
Healthy pace of branch expansion, backed by distribution
Axis Bank
1,16,116
487
630
29.5
network, will be the driving force for the bank’s retail business
and overall earnings.
Uptick in defense capex by government when coupled with
Bharat Electronics
30,227
1,259
1,414
12.3
BELs strong market positioning, indicate that good times are
ahead for BEL.
The stock is trading at attractive valuations and is factoring all
HCL Tech
1,11,527
791
1,000
26.5
the bad news.
Back on the growth trend, expect a long term growth of 14%
Infosys
2,33,105
1,015
1,249
23.0
to be a US$20bn in FY2020.
Source: Company, Angel Research
Mid Cap
M
arket Cap
CM
P
T
arget
Upsid
e
Company
Rationale
(` Cr)
(`)
(`)
(%)
We expect the company would report strong profitability
Asian Granito
825
274
351
28.1
owing to better product mix, higher B2C sales and
amalgamation synergy.
Among the top 4 players in the consumer durables segment.
Bajaj Electricals
2,615
259
306
18.3
Improved profitability backed by turn around in E&P segment.
Strong order book lends earnings visibility.
Favourable outlook for the AC industry to augur well for
Cooling products business which is out pacing the market
Blue Star
5,265
552
634
14.8
growth. EMPPAC division's profitability to improve once
operating environment turns around.
With a focus on the low and medium income (LMI) consumer
Dewan Housing Finance
9,297
319
350
9.9
segment, the company has increased its presence in tier-II &
III cities where the growth opportunity is immense.
Strong loan growth backed by diversified loan portfolio and
Equitas Holdings
5,919
177
235
33.1
adequate CAR. ROE & ROA likely to remain decent as risk of
dilution remains low. Attractive valuations considering growth.
Economic recovery to have favourable impact on advertising
& circulation revenue growth. Further, the acquisition of a
Jagran Prakashan
6,370
195
225
15.5
radio business (Radio City) would also boost the company's
revenue growth.
Speedier execution and speedier sales, strong revenue visibilty
Mahindra Lifespace
1,807
440
522
18.5
in short-to-long run, attractive valuations
We expect the company to report strong growth on back of
healthy growth in domestic branded sales (owing to
Mirza International
1,130
94
113
20.3
aggressive ad spend and addition in the number of EBOs &
multi-brand outlets [MBOs]) and healthy export revenues.
Massive capacity expansion along with rail advantage at ICD
Navkar Corporation
2,795
196
265
35.2
as well CFS augurs well for the company.
Strong brands and distribution network would boost growth
Siyaram Silk Mills
1,423
1,518
1,714
12.9
going ahead. Stock currently trades at an inexpensive
valuation.
Market leadership in Hindi news genre and no. 2 viewership
ranking in English news genre, exit from the radio business,
TV Today Network
1,980
332
363
9.3
and anticipated growth in ad spends by corporates to benefit
the stock.
Source: Company, Angel Research
Market Outlook
October 27, 2016
Key Upcoming Events
Result Calendar
Date
Company
Maruti, TVS Motor, ABB, Vijaya Bank, Tech Mahindra, PVR, JSW Steel , ONGC, IOC, MRF, GSK Pharma, Glenmark
Oct 27, 2016
Pharma., Dishman Pharma, VRL Logistics
Oct 28, 2016
United Phosphorus, Bajaj Auto, Subros, IDFC, Nestle, Colgate, Marico, Sesa Goa, Heritage Foods, NTPC
Nov 1, 2016
Hindustan Media Ventures
Nov 2, 2016
HT Media
Nov 3, 2016
Ambuja Cements, Mphasis, MM Forging
Nov 4, 2016
Union Bank, Allahabad Bank, Competent Automobiles, Transport Corporation of India, Radico Khaitan
Nov 5, 2016
Amara Raja Batteries, Mangalam Cement, Punjab Natl.Bank, Sterling Tools
Source: Bloomberg, Angel Research
Global economic events release calendar
Date
Time
Country
Event Description
Unit
Period
Bloomberg Data
Last Reported Estimated
Oct 27, 2016 6:00PM US
Initial Jobless claims
Thousands
Oct 22
260.00
255.00
2:30PM Euro Zone
Euro-Zone Consumer Confidence
Value
Oct F
(8.00)
(8.00)
Oct 28, 2016 2:00PM UK
GDP (YoY)
% Change
3Q A
2.10
2.10
6:00PM US
GDP Qoq (Annualised)
% Change
3Q A
1.40
2.50
Oct 31, 2016 6:30AM China
PMI Manufacturing
Value
Oct
50.40
50.40
Nov 1, 2016
3:30PM Euro Zone
Euro-Zone GDP s.a. (QoQ)
% Change
3Q A
0.30
--
3:00PM UK
PMI Manufacturing
Value
Oct
55.40
--
Nov 2, 2016
2:25PM Germany
PMI Manufacturing
Value
Oct F
55.10
--
2:25PM Germany
Unemployment change (000's)
Thousands
Oct
1.00
--
11:30PM US
FOMC rate decision
%
Nov 2
0.50
0.50
Nov 3, 2016
5:30PM UK
BOE Announces rates
% Ratio
Nov 3
0.25
--
Nov 4, 2016
2:25PM Germany
PMI Services
Value
Oct F
54.10
--
6:00PM US
Change in Nonfarm payrolls
Thousands
Oct
156.00
169.00
6:00PM US
Unnemployment rate
%
Oct
5.00
4.90
Nov 8, 2016
China
Exports YoY%
% Change
Oct
(10.00)
--
3:00PM UK
Industrial Production (YoY)
% Change
Sep
0.70
--
Nov 9, 2016
India
Imports YoY%
% Change
Oct
(2.50)
--
Nov 10, 2016 7:00AM China
Consumer Price Index (YoY)
% Change
Oct
1.90
--
India
Exports YoY%
% Change
Oct
4.60
--
Nov 11, 2016 5:30PM India
Industrial Production YoY
% Change
Sep
(0.70)
--
Nov 14, 2016 7:30AM China
Industrial Production (YoY)
% Change
Oct
6.10
--
12:00PM India
Monthly Wholesale Prices YoY%
% Change
Oct
3.57
--
Nov 15, 2016 3:00PM UK
CPI (YoY)
% Change
Oct
1.00
--
12:30PM Germany
GDP nsa (YoY)
% Change
3Q P
3.10
--
Source: Bloomberg, Angel Research
Market Outlook
October 27, 2016
Macro watch
Exhibit 1: Quarterly GDP trends
Exhibit 2: IIP trends
(%)
(%)
9.0
12.0
8.3
9.9
7.8
7.9
10.0
8.0
7.5
7.5
7.6
7.2
7.1
8.0
6.6
6.7
7.0
6.4
6.0
5.8
6.0
4.0
1.9
2.0
1.3
2.0
0.3
5.0
-
4.0
(2.0)
(0.7)
(0.9)
(1.3)
(1.6)
(4.0)
(2.5)
3.0
(3.4)
(6.0)
Source: CSO, Angel Research
Source: MOSPI, Angel Research
Exhibit 3: Monthly CPI inflation trends
Exhibit 4: Manufacturing and services PMI
56.0
Mfg. PMI
Services PMI
(%)
55.0
7.0
6.1
54.0
5.6
5.7
5.8
5.8
6.0
5.4
5.5
5.0
5.3
5.1
53.0
4.8
5.0
4.3
52.0
4.0
51.0
50.0
3.0
49.0
2.0
48.0
1.0
47.0
46.0
-
Source: Market, Angel Research; Note: Level above 50 indicates expansion
Source: MOSPI, Angel Research
Exhibit 5: Exports and imports growth trends
Exhibit 6: Key policy rates
(%)
Exports yoy growth
Imports yoy growth
(%)
Repo rate
Reverse Repo rate
CRR
10.0
7.00
5.0
6.50
0.0
6.00
(5.0)
5.50
(10.0)
5.00
(15.0)
4.50
(20.0)
4.00
(25.0)
(30.0)
3.50
(35.0)
3.00
Source: Bloomberg, Angel Research
Source: RBI, Angel Research
Market Outlook
October 27, 2016
Global watch
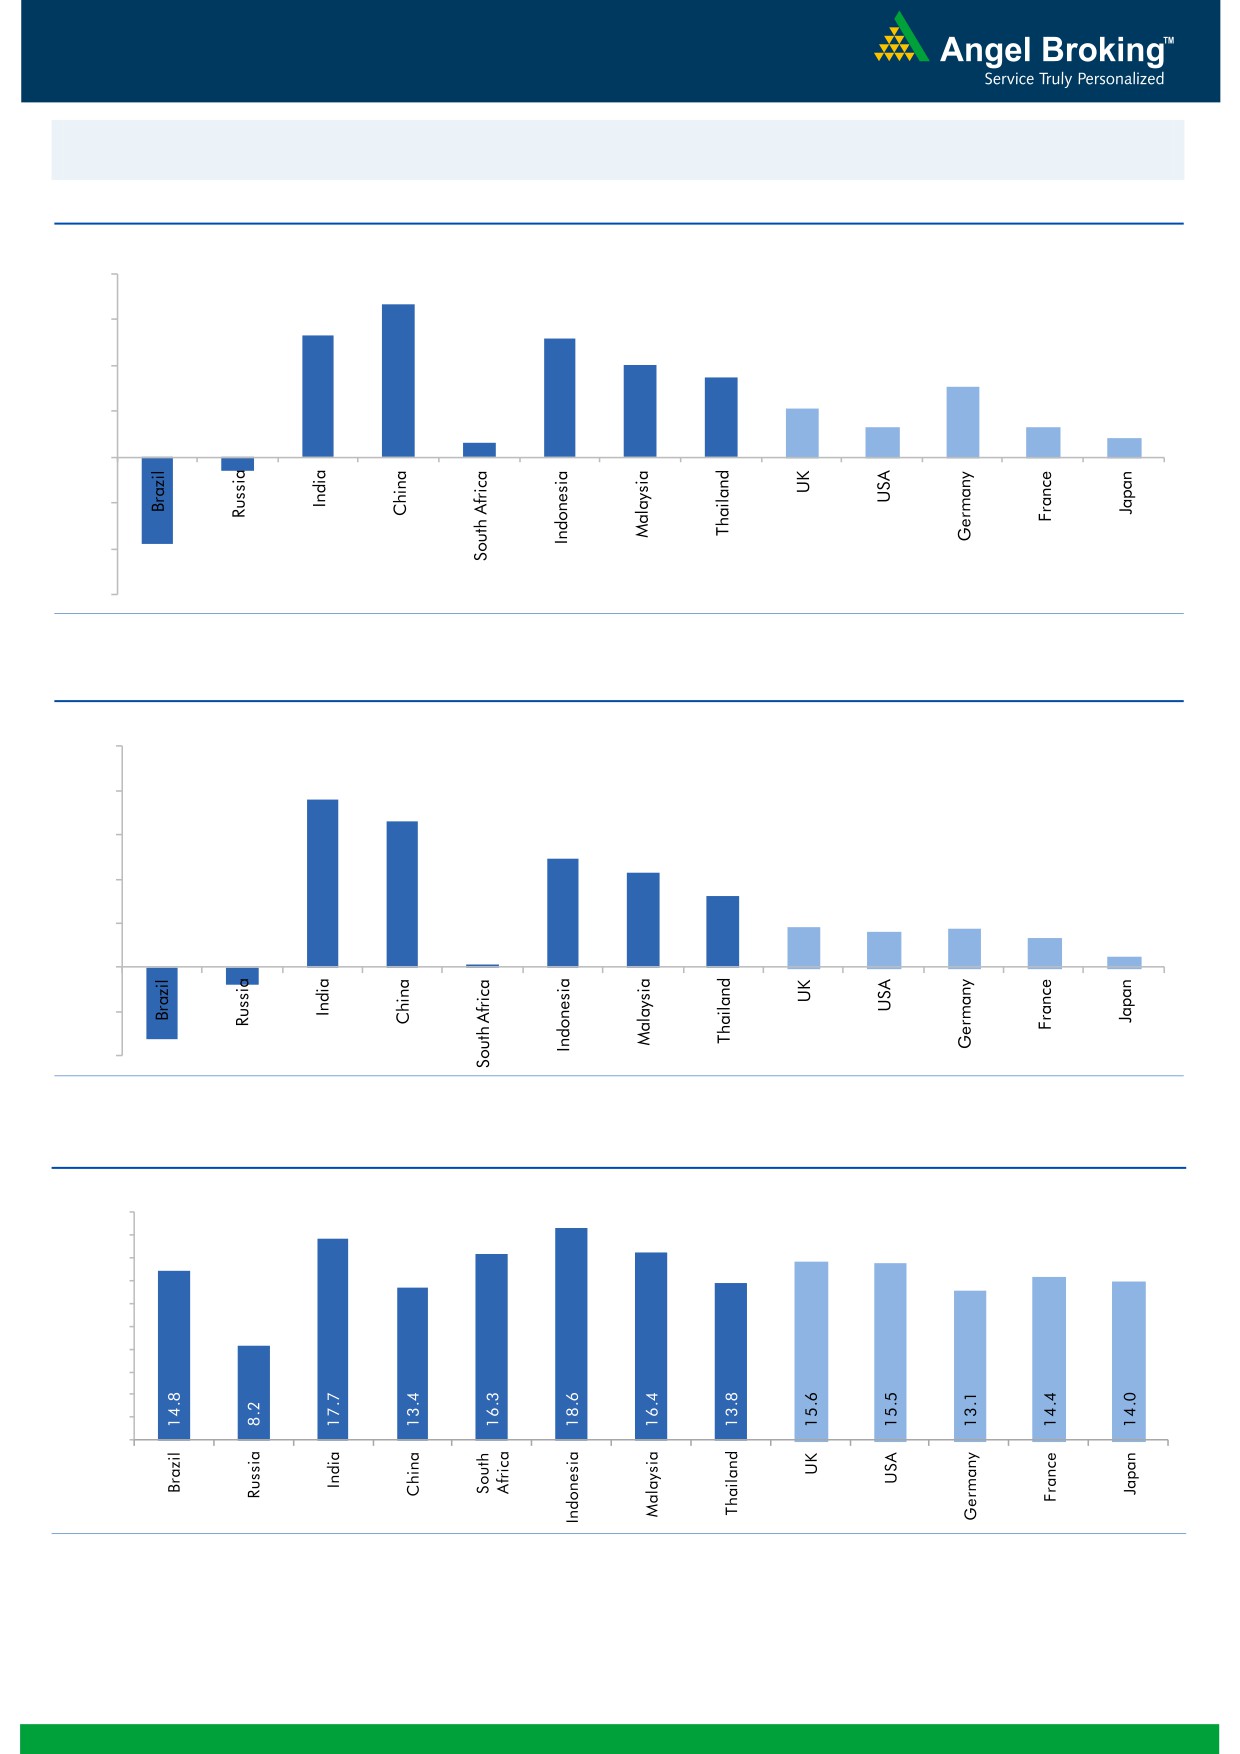
Exhibit 1: Latest quarterly GDP Growth (%, yoy) across select developing and developed countries
(%)
8.0
6.7
6.0
5.3
0.6
5.2
4.0
3.5
4.0
3.1
2.1
2.0
1.3
1.3
0.8
-
(2.0)
(0.6)
(4.0)
(3.8)
(6.0)
Source: Bloomberg, Angel Research
Exhibit 2: 2016 GDP Growth projection by IMF (%, yoy) across select developing and developed countries
(%)
10.0
7.6
8.0
6.6
6.0
4.9
4.3
4.0
3.2
1.8
1.7
1.6
2.0
1.3
(0.8)
0.5
(3.3)
0.1
-
(2.0)
(4.0)
Source: IMF, Angel Research
Exhibit 3: One year forward P-E ratio across select developing and developed countries
(x)
20.0
18.0
16.0
14.0
12.0
10.0
8.0
6.0
4.0
2.0
-
Source: IMF, Angel Research
Market Outlook
October 27, 2016
Exhibit 4: Relative performance of indices across globe
Returns (%)
Country
Name of index
Closing price
1M
3M
1YR
Brazil
Bovespa
63,826
8.3
12.3
35.7
Russia
Micex
1,975
(1.7)
2.0
14.6
India
Nifty
8,615
(1.0)
1.5
6.3
China
Shanghai Composite
3,116
3.3
2.9
(7.8)
South Africa
Top 40
45,011
(0.5)
(2.9)
(7.4)
Mexico
Mexbol
47,805
0.7
2.5
7.6
Indonesia
LQ45
923
(0.9)
2.7
20.1
Malaysia
KLCI
1,674
0.2
1.0
(2.6)
Thailand
SET 50
938
(1.2)
(1.1)
3.6
USA
Dow Jones
18,199
(0.5)
(1.6)
3.3
UK
FTSE
6,958
2.1
3.1
8.8
Japan
Nikkei
17,392
3.8
4.6
(4.9)
Germany
DAX
10,710
0.8
5.0
(0.7)
France
CAC
4,535
1.2
2.1
(8.0)
Source: Bloomberg, Angel Research
Stock Watch
October 27, 2016
Company Name
Reco
CMP
Target
Mkt Cap
Sales ( Čcr )
OPM(%)
EPS (Č)
PER(x)
P/BV(x)
RoE(%)
EV/Sales(x)
(Č)
Price ( Č)
( Č cr )
FY17E FY18E
FY17E
FY18E
FY17E
FY18E
FY17E
FY18E
FY17E
FY18E
FY17E
FY18E
FY17E
FY18E
Agri / Agri Chemical
Rallis
Neutral
225
-
4,384
1,937
2,164
13.3
14.3
9.0
11.0
25.1
20.5
4.4
3.8
18.4
19.8
2.4
2.1
United Phosphorus
Neutral
698
-
35,403
15,176
17,604
18.5
18.5
37.4
44.6
18.7
15.7
3.7
3.0
21.4
21.2
2.5
2.1
Auto & Auto Ancillary
Ashok Leyland
Buy
87
111
24,802
22,407
26,022
10.6
10.6
5.2
6.4
16.7
13.6
3.8
3.2
23.6
24.7
1.2
1.0
Bajaj Auto
Neutral
2,819
-
81,562
25,093
27,891
19.5
19.2
143.9
162.5
19.6
17.4
5.5
4.7
30.3
29.4
3.0
2.6
Bharat Forge
Neutral
872
-
20,308
7,726
8,713
20.5
21.2
35.3
42.7
24.7
20.4
4.6
4.1
18.9
20.1
2.7
2.3
Eicher Motors
Neutral
24,419
-
66,324
16,583
20,447
17.5
18.0
598.0
745.2
40.8
32.8
14.0
10.6
41.2
38.3
3.9
3.1
Gabriel India
Neutral
124
-
1,786
1,544
1,715
9.0
9.3
5.4
6.3
23.0
19.7
4.4
3.9
18.9
19.5
1.1
1.0
Hero Motocorp
Neutral
3,422
-
68,324
31,253
35,198
15.3
15.0
172.3
192.1
19.9
17.8
7.3
6.2
38.9
37.0
2.0
1.8
Jamna Auto Industries Neutral
225
-
1,797
1,486
1,620
9.8
9.9
15.0
17.2
15.0
13.1
3.3
2.8
21.8
21.3
1.3
1.2
L G Balakrishnan & Bros Neutral
695
-
1,091
1,302
1,432
11.6
11.9
43.7
53.0
15.9
13.1
2.2
2.0
13.8
14.2
0.9
0.8
Mahindra and Mahindra Neutral
1,310
-
81,354
46,534
53,077
11.6
11.7
67.3
78.1
19.5
16.8
3.2
2.8
15.4
15.8
1.7
1.5
Maruti
Neutral
5,872
-
177,380
69,186
82,217
14.7
14.4
198.5
241.4
29.6
24.3
5.8
4.7
20.2
20.0
2.2
1.8
Minda Industries
Neutral
366
-
2,900
2,728
3,042
9.0
9.1
68.2
86.2
5.4
4.2
1.2
1.0
23.8
24.3
1.1
1.0
Motherson Sumi
Neutral
330
-
46,319
45,896
53,687
7.8
8.3
13.0
16.1
25.3
20.5
8.2
6.5
34.7
35.4
1.1
0.9
Rane Brake Lining
Neutral
1,204
-
953
511
562
11.3
11.5
28.1
30.9
42.9
39.0
6.5
5.9
15.3
15.0
2.1
1.9
Setco Automotive
Neutral
43
-
573
741
837
13.0
13.0
15.2
17.0
2.8
2.5
0.5
0.4
15.8
16.3
1.2
1.1
Tata Motors
Neutral
530
-
152,877
300,209
338,549
8.9
8.4
42.7
54.3
12.4
9.8
2.0
1.7
15.6
17.2
0.6
0.6
TVS Motor
Neutral
400
-
18,989
13,390
15,948
6.9
7.1
12.8
16.5
31.3
24.2
7.8
6.2
26.3
27.2
1.5
1.2
Amara Raja Batteries
Buy
1,017
1,218
17,379
5,429
6,471
17.5
17.6
35.3
43.5
28.8
23.4
6.6
5.4
25.3
24.8
3.1
2.5
Exide Industries
Neutral
202
-
17,179
7,439
8,307
15.0
15.0
8.1
9.3
25.0
21.7
3.5
3.1
14.3
16.7
1.9
1.7
Apollo Tyres
Accumulate
209
235
10,636
12,877
14,504
14.3
13.9
21.4
23.0
9.8
9.1
1.5
1.3
16.4
15.2
1.0
0.9
Ceat
Accumulate
1,222
1,450
4,943
7,524
8,624
13.0
12.7
131.1
144.3
9.3
8.5
1.7
1.5
19.8
18.6
0.8
0.7
JK Tyres
Neutral
146
-
3,302
7,455
8,056
15.0
15.0
21.8
24.5
6.7
5.9
1.4
1.1
22.8
21.3
0.6
0.5
Swaraj Engines
Neutral
1,328
-
1,649
660
810
15.2
16.4
54.5
72.8
24.4
18.2
7.6
6.9
31.5
39.2
2.4
1.9
Subros
Neutral
141
-
847
1,488
1,681
11.7
11.9
6.4
7.2
22.1
19.7
2.3
2.1
10.8
11.4
0.8
0.7
Indag Rubber
Neutral
195
-
511
286
326
19.8
16.8
11.7
13.3
16.6
14.6
2.8
2.6
17.8
17.1
1.5
1.3
Capital Goods
ACE
Neutral
46
-
456
709
814
4.1
4.6
1.4
2.1
32.9
21.9
1.4
1.3
4.4
6.0
0.8
0.7
BEML
Buy
918
1,157
3,823
3,451
4,055
6.3
9.2
31.4
57.9
29.2
15.9
1.8
1.6
6.3
10.9
1.2
1.0
Bharat Electronics
Accumulate
1,259
1,414
30,227
8,137
9,169
16.8
17.2
58.7
62.5
21.5
20.2
3.3
3.0
44.6
46.3
2.7
2.4
Stock Watch
October 27, 2016
Company Name
Reco
CMP
Target
Mkt Cap
Sales ( Čcr )
OPM(%)
EPS (Č)
PER(x)
P/BV(x)
RoE(%)
EV/Sales(x)
(Č)
Price ( Č)
( Č cr )
FY17E
FY18E
FY17E
FY18E
FY17E
FY18E
FY17E
FY18E
FY17E
FY18E
FY17E
FY18E
FY17E
FY18E
Capital Goods
Voltas
Neutral
385
-
12,739
6,511
7,514
7.9
8.7
12.9
16.3
29.8
23.6
5.4
4.7
16.7
18.5
1.8
1.5
BGR Energy
Neutral
116
-
840
16,567
33,848
6.0
5.6
7.8
5.9
14.9
19.7
0.9
0.8
4.7
4.2
0.2
0.1
BHEL
Neutral
140
-
34,156
28,797
34,742
-
2.8
2.3
6.9
60.7
20.2
1.0
1.0
1.3
4.8
0.8
0.6
Blue Star
Buy
552
634
5,265
4,283
5,077
5.9
7.3
14.9
22.1
37.1
25.0
7.2
6.1
20.4
26.4
1.3
1.1
Crompton Greaves
Neutral
75
-
4,697
5,777
6,120
5.9
7.0
3.3
4.5
22.7
16.7
1.0
1.0
4.4
5.9
0.8
0.7
Greaves Cotton
Neutral
138
-
3,370
1,755
1,881
16.8
16.9
7.8
8.5
17.7
16.2
3.5
3.3
20.6
20.9
1.6
1.5
Inox Wind
Buy
215
286
4,778
5,605
6,267
15.7
16.4
24.8
30.0
8.7
7.2
2.4
1.8
25.9
24.4
0.9
0.8
KEC International
Neutral
126
-
3,251
9,294
10,186
7.9
8.1
9.9
11.9
12.8
10.6
1.9
1.6
15.6
16.3
0.6
0.5
Thermax
Neutral
849
-
10,115
5,421
5,940
7.3
7.3
25.7
30.2
33.0
28.1
4.0
3.7
12.2
13.1
1.8
1.6
VATech Wabag
Buy
503
681
2,742
3,136
3,845
8.9
9.1
26.0
35.9
19.4
14.0
2.4
2.1
13.4
15.9
0.8
0.6
Cement
ACC
Neutral
1,544
-
28,988
11,225
13,172
13.2
16.9
44.5
75.5
34.7
20.5
3.3
3.0
11.2
14.2
2.6
2.2
Ambuja Cements
Neutral
248
-
49,234
9,350
10,979
18.2
22.5
5.8
9.5
42.8
26.1
3.6
3.2
10.2
12.5
5.3
4.5
India Cements
Neutral
156
-
4,803
4,364
4,997
18.5
19.2
7.9
11.3
19.8
13.8
1.4
1.4
8.0
8.5
1.9
1.6
JK Cement
Neutral
928
-
6,486
4,398
5,173
15.5
17.5
31.2
55.5
29.7
16.7
3.6
3.1
12.0
15.5
2.0
1.7
J K Lakshmi Cement
Accumulate
490
565
5,765
2,913
3,412
14.5
19.5
7.5
22.5
65.3
21.8
4.0
3.4
12.5
18.0
2.6
2.2
Orient Cement
Buy
175
215
3,581
2,114
2,558
18.5
20.5
8.1
11.3
21.6
15.5
3.2
2.7
9.0
14.0
2.3
1.8
UltraTech Cement
Neutral
3,939
-
108,089
25,768
30,385
21.0
23.5
111.0
160.0
35.5
24.6
4.5
4.0
13.5
15.8
4.4
3.6
Construction
ITNL
Neutral
113
-
3,729
8,946
10,017
31.0
31.6
8.1
9.1
14.0
12.5
0.5
0.5
4.2
5.0
3.8
3.5
KNR Constructions
Neutral
786
-
2,209
1,385
1,673
14.7
14.0
41.2
48.5
19.1
16.2
3.6
3.1
14.9
15.2
1.7
1.4
Larsen & Toubro
Accumulate
1,483
1,700
138,189
67,665
77,249
10.7
11.5
57.3
71.2
25.9
20.8
2.4
2.2
12.6
14.3
2.2
1.9
Gujarat Pipavav Port
Neutral
168
-
8,107
705
788
52.2
51.7
5.0
5.6
33.5
30.0
3.3
3.0
11.2
11.2
11.3
9.6
Nagarjuna Const.
Neutral
92
-
5,115
8,842
9,775
9.1
8.8
5.3
6.4
17.4
14.4
1.4
1.3
8.2
9.1
0.8
0.7
PNC Infratech
Buy
123
143
3,148
2,350
2,904
13.1
13.2
9.0
8.8
13.6
13.9
0.5
0.4
15.9
13.9
1.5
1.2
Simplex Infra
Neutral
332
-
1,642
6,829
7,954
10.5
10.5
31.4
37.4
10.6
8.9
1.1
1.0
9.9
13.4
0.7
0.6
Power Mech Projects
Neutral
506
-
745
1,801
2,219
12.7
14.6
72.1
113.9
7.0
4.5
1.3
1.1
16.8
11.9
0.4
0.3
Sadbhav Engineering
Accumulate
276
298
4,735
3,598
4,140
10.3
10.6
9.0
11.9
30.7
23.2
3.2
2.8
9.9
11.9
1.6
1.4
NBCC
Neutral
238
-
14,271
7,428
9,549
7.9
8.6
8.2
11.0
29.0
21.6
1.4
1.1
28.2
28.7
1.7
1.2
MEP Infra
Neutral
43
-
691
1,877
1,943
30.6
29.8
3.0
4.2
14.2
10.1
6.9
4.6
0.6
0.6
1.8
1.6
SIPL
Neutral
104
-
3,660
1,036
1,252
65.5
66.2
(8.4)
(5.6)
3.9
4.4
(22.8)
(15.9)
11.8
9.8
Stock Watch
October 27, 2016
Company Name
Reco
CMP
Target
Mkt Cap
Sales ( Čcr )
OPM(%)
EPS (Č)
PER(x)
P/BV(x)
RoE(%)
EV/Sales(x)
(Č)
Price ( Č)
( Č cr )
FY17E
FY18E
FY17E
FY18E
FY17E
FY18E
FY17E
FY18E
FY17E
FY18E
FY17E
FY18E
FY17E
FY18E
Construction
Engineers India
Neutral
270
-
9,106
1,725
1,935
16.0
19.1
11.4
13.9
23.7
19.4
3.3
3.2
13.4
15.3
4.3
3.8
Financials
Axis Bank
Buy
487
630
116,116
46,932
53,575
3.5
3.4
32.4
44.6
15.0
10.9
1.9
1.7
13.6
16.5
-
-
Bank of Baroda
Neutral
155
-
35,749
19,980
23,178
1.8
1.8
11.5
17.3
13.5
9.0
1.5
1.3
8.3
10.1
-
-
Canara Bank
Neutral
314
-
17,061
15,225
16,836
1.8
1.8
14.5
28.0
21.7
11.2
1.5
1.2
5.8
8.5
-
-
Dewan Housing Finance Accumulate
319
350
9,297
2,225
2,688
2.9
2.9
29.7
34.6
10.7
9.2
1.7
1.5
16.1
16.8
-
-
Equitas Holdings
Buy
177
235
5,919
939
1,281
11.7
11.5
5.8
8.2
30.4
21.5
2.6
2.3
10.9
11.5
-
-
Federal Bank
Neutral
82
-
14,089
9,353
10,623
2.9
2.9
4.4
5.8
18.6
14.1
1.8
1.6
9.5
11.0
-
-
HDFC
Neutral
1,336
-
211,209
11,475
13,450
3.4
3.4
45.3
52.5
29.5
25.5
5.7
5.0
20.2
20.5
-
-
HDFC Bank
Accumulate
1,240
1,350
314,037
46,097
55,433
4.5
4.5
58.4
68.0
21.2
18.2
3.7
3.1
18.8
18.6
-
-
ICICI Bank
Neutral
279
-
162,030
39,029
45,903
3.3
3.3
16.7
16.3
16.7
17.1
2.1
1.9
10.1
12.4
-
-
LIC Housing Finance
Accumulate
586
630
29,573
3,712
4,293
2.6
2.5
39.0
46.0
15.0
12.7
2.8
2.4
19.9
20.1
-
-
Punjab Natl.Bank
Neutral
144
-
30,643
23,532
23,595
2.3
2.4
6.8
12.6
21.2
11.4
3.3
2.3
3.3
6.5
-
-
RBL Bank
Accumulate
353
365
13,071
1,783
2,309
2.6
2.6
12.7
16.4
27.8
21.6
3.0
2.7
12.8
13.3
-
-
South Ind.Bank
Neutral
24
-
3,241
6,435
7,578
2.5
2.5
2.7
3.1
8.9
7.7
1.1
1.0
10.1
11.2
-
-
St Bk of India
Neutral
259
-
201,095
88,650
98,335
2.6
2.6
13.5
18.8
19.2
13.8
1.8
1.6
7.0
8.5
-
-
Union Bank
Neutral
145
-
9,934
13,450
14,925
2.3
2.3
25.5
34.5
5.7
4.2
0.8
0.7
7.5
10.2
-
-
Yes Bank
Neutral
1,289
-
54,258
8,978
11,281
3.3
3.4
74.0
90.0
17.4
14.3
3.3
2.8
17.0
17.2
-
-
FMCG
Asian Paints
Neutral
1,123
-
107,689
17,128
18,978
16.8
16.4
19.1
20.7
58.8
54.2
20.5
19.3
34.8
35.5
6.3
5.7
Britannia
Accumulate
3,263
3,626
39,154
9,795
11,040
14.6
14.9
80.3
94.0
40.6
34.7
16.7
12.9
41.2
-
3.9
3.4
Colgate
Accumulate
926
995
25,198
4,605
5,149
23.4
23.4
23.8
26.9
38.9
34.4
21.6
16.8
64.8
66.8
5.5
4.9
Dabur India
Accumulate
296
304
52,141
8,315
9,405
19.8
20.7
8.1
9.2
36.6
32.2
10.2
8.4
31.6
31.0
5.7
5.0
GlaxoSmith Con*
Neutral
5,968
-
25,100
4,350
4,823
21.2
21.4
179.2
196.5
33.3
30.4
8.8
7.5
27.1
26.8
5.3
4.7
Godrej Consumer
Neutral
1,579
-
53,765
10,235
11,428
18.4
18.6
41.1
44.2
38.4
35.7
8.5
7.2
24.9
24.8
5.5
4.8
HUL
Neutral
843
-
182,403
35,252
38,495
17.6
17.4
20.4
21.9
41.3
38.5
33.9
29.7
82.2
77.3
4.9
4.5
ITC
Buy
239
283
288,372
40,059
44,439
39.0
39.2
9.1
10.1
26.3
23.7
7.2
6.3
27.2
26.5
6.7
6.0
Marico
Accumulate
281
300
36,247
6,430
7,349
18.8
19.5
6.4
7.7
43.9
36.5
13.3
11.2
33.2
32.5
5.5
4.8
Nestle*
Neutral
6,822
-
65,772
10,073
11,807
20.7
21.5
124.8
154.2
54.7
44.2
22.4
20.2
34.8
36.7
6.3
5.4
Tata Global
Neutral
145
-
9,177
8,675
9,088
9.8
9.8
7.4
8.2
19.7
17.7
2.2
2.1
7.9
8.1
1.0
0.9
Procter & Gamble
Neutral
7,028
-
22,813
2,939
3,342
23.2
23.0
146.2
163.7
48.1
42.9
107.6
103.2
25.3
23.5
7.3
6.4
Hygiene
Stock Watch
October 27, 2016
Company Name
Reco
CMP
Target
Mkt Cap
Sales ( Čcr )
OPM(%)
EPS (Č)
PER(x)
P/BV(x)
RoE(%)
EV/Sales(x)
(Č)
Price ( Č)
( Č cr )
FY17E FY18E
FY17E
FY18E
FY17E
FY18E
FY17E
FY18E
FY17E
FY18E
FY17E
FY18E
FY17E
FY18E
IT
HCL Tech^
Buy
791
1,000
111,527
49,242
57,168
20.5
20.5
55.7
64.1
14.2
12.3
2.9
2.2
20.3
17.9
2.2
1.8
Infosys
Buy
1,015
1,249
233,105
68,350
77,326
27.0
27.0
62.5
69.4
16.2
14.6
3.5
3.2
21.3
21.6
2.9
2.5
TCS
Accumulate
2,397
2,620
472,302
119,025
133,308
27.6
27.6
131.2
145.5
18.3
16.5
5.9
5.5
32.4
33.1
3.7
3.3
Tech Mahindra
Buy
425
700
41,284
30,347
33,685
17.0
17.0
37.5
41.3
11.3
10.3
2.5
2.1
21.8
20.7
1.1
0.9
Wipro
Buy
472
590
114,828
55,440
60,430
18.1
18.1
35.9
39.9
13.2
11.8
2.4
2.2
19.0
19.3
1.8
1.7
Media
D B Corp
Neutral
384
-
7,065
2,297
2,590
27.4
28.2
21.0
23.4
18.3
16.4
4.3
3.7
23.7
23.1
2.9
2.5
HT Media
Neutral
88
-
2,046
2,693
2,991
12.6
12.9
7.9
9.0
11.1
9.8
1.0
0.9
7.8
8.3
0.4
0.2
Jagran Prakashan
Accumulate
195
225
6,370
2,355
2,635
28.0
28.0
10.8
12.5
18.0
15.6
3.9
3.4
21.7
21.7
2.8
2.4
Sun TV Network
Neutral
538
-
21,212
2,850
3,265
70.1
71.0
26.2
30.4
20.5
17.7
5.3
4.6
24.3
25.6
7.0
5.9
Hindustan Media
Neutral
300
-
2,204
1,016
1,138
24.3
25.2
27.3
30.1
11.0
10.0
2.1
1.9
16.2
15.8
1.5
1.3
Ventures
TV Today Network
Accumulate
332
363
1,981
637
743
27.5
27.5
18.4
21.4
18.1
15.5
3.2
2.7
17.4
17.2
2.7
2.3
Metals & Mining
Coal India
Neutral
319
-
201,745
84,638
94,297
21.4
22.3
24.5
27.1
13.0
11.8
5.4
5.2
42.6
46.0
1.9
1.7
Hind. Zinc
Neutral
252
-
106,541
14,252
18,465
55.9
48.3
15.8
21.5
16.0
11.7
2.6
2.3
17.0
20.7
7.5
5.8
Hindalco
Neutral
150
-
30,975
107,899
112,095
7.4
8.2
9.2
13.0
16.3
11.5
0.8
0.7
4.8
6.6
0.8
0.8
JSW Steel
Neutral
1,670
-
40,358
53,201
58,779
16.1
16.2
130.6
153.7
12.8
10.9
1.7
1.5
14.0
14.4
1.5
1.3
NMDC
Neutral
121
-
47,795
6,643
7,284
44.4
47.7
7.1
7.7
17.0
15.7
1.5
1.4
8.8
9.2
5.1
4.6
SAIL
Neutral
51
-
20,940
47,528
53,738
(0.7)
2.1
(1.9)
2.6
19.5
0.6
0.5
(1.6)
3.9
1.3
1.2
Vedanta
Neutral
201
-
59,709
71,744
81,944
19.2
21.7
13.4
20.1
15.0
10.0
1.3
1.2
8.4
11.3
1.2
0.9
Tata Steel
Neutral
399
-
38,737
121,374
121,856
7.2
8.4
18.6
34.3
21.4
11.6
1.3
1.2
6.1
10.1
1.0
1.0
Oil & Gas
Cairn India
Neutral
227
-
42,559
9,127
10,632
4.3
20.6
8.8
11.7
25.8
19.4
0.8
0.8
3.3
4.2
6.2
5.1
GAIL
Neutral
432
-
54,855
56,220
65,198
9.3
10.1
27.1
33.3
16.0
13.0
1.5
1.4
9.3
10.7
1.2
1.0
ONGC
Neutral
290
-
248,238
137,222
152,563
15.0
21.8
19.5
24.1
14.9
12.0
1.3
1.2
8.5
10.1
2.1
1.9
Indian Oil Corp
Neutral
322
-
156,117
373,359
428,656
5.9
5.5
54.0
59.3
6.0
5.4
0.9
0.8
16.0
15.6
0.6
0.5
Reliance Industries
Neutral
1,054
-
341,802
301,963
358,039
12.1
12.6
87.7
101.7
12.0
10.4
1.2
1.1
10.7
11.3
1.6
1.3
Pharmaceuticals
Alembic Pharma
Neutral
662
-
12,470
3,483
4,083
20.2
21.4
24.3
30.4
27.2
21.8
6.2
4.9
25.5
25.3
3.6
3.0
Aurobindo Pharma
Accumulate
806
877
47,165
15,720
18,078
23.7
23.7
41.4
47.3
19.5
17.0
5.1
4.0
29.6
26.1
3.3
2.9
Sanofi India*
Neutral
4,240
-
9,765
2,357
2,692
17.3
17.3
153.5
169.2
27.6
25.1
4.7
3.8
25.8
28.4
3.9
3.2
Cadila Healthcare
Neutral
388
-
39,726
11,126
13,148
22.0
22.0
17.1
20.0
22.7
19.4
5.8
4.6
28.8
26.6
3.8
3.1
Cipla
Neutral
577
-
46,390
15,378
18,089
17.4
18.4
21.6
27.2
26.7
21.2
3.5
3.0
13.7
15.2
3.3
2.7
Stock Watch
October 27, 2016
Company Name
Reco
CMP
Target
Mkt Cap
Sales ( Čcr )
OPM(%)
EPS (Č)
PER(x)
P/BV(x)
RoE(%)
EV/Sales(x)
(Č)
Price ( Č)
( Č cr )
FY17E FY18E
FY17E
FY18E
FY17E
FY18E
FY17E
FY18E
FY17E
FY18E
FY17E
FY18E
FY17E
FY18E
Pharmaceuticals
Dr Reddy's
Neutral
3,243
-
53,741
16,043
18,119
23.1
24.7
126.0
157.8
25.7
20.6
3.8
3.3
15.7
17.1
3.3
2.9
Dishman Pharma
Neutral
228
-
3,673
1,718
1,890
22.7
22.8
9.5
11.3
24.0
20.1
2.3
2.1
10.1
10.9
2.6
2.3
GSK Pharma*
Neutral
2,920
-
24,735
3,528
3,811
16.6
18.8
51.8
59.4
56.4
49.2
15.1
15.0
26.3
30.6
6.8
6.4
Indoco Remedies
Neutral
297
-
2,732
1,112
1,289
18.2
18.2
13.2
15.6
22.5
19.0
4.0
3.4
19.2
19.2
2.6
2.2
Ipca labs
Neutral
620
-
7,821
3,303
3,799
15.3
15.3
17.3
19.7
35.8
31.5
3.1
2.9
9.1
9.4
2.5
2.2
Lupin
Buy
1,509
1,809
68,014
15,912
18,644
26.4
26.7
58.1
69.3
26.0
21.8
5.1
4.1
21.4
20.9
4.4
3.6
Sun Pharma
Buy
740
944
177,987
31,129
35,258
30.0
30.9
28.0
32.8
26.4
22.6
4.1
3.4
18.7
18.9
5.4
4.5
Power
Tata Power
Neutral
81
-
21,867
36,916
39,557
17.4
27.1
5.1
6.3
15.9
12.8
1.4
1.3
9.0
10.3
1.6
1.5
NTPC
Neutral
152
-
125,290
86,605
95,545
17.5
20.8
11.8
13.4
12.9
11.3
1.3
1.2
10.5
11.1
2.8
2.8
Power Grid
Neutral
176
-
92,050
25,763
29,762
74.3
73.1
14.8
17.3
11.9
10.2
1.9
1.6
16.9
17.5
7.9
7.5
Real Estate
MLIFE
Buy
440
522
1,807
1,152
1,300
22.7
24.6
29.9
35.8
14.7
12.3
1.1
1.0
7.6
8.6
2.3
1.9
Telecom
Bharti Airtel
Neutral
318
-
127,137
105,086
114,808
34.5
34.7
12.2
16.4
26.1
19.4
1.8
1.6
6.8
8.4
2.1
1.8
Idea Cellular
Neutral
79
-
28,338
40,133
43,731
37.2
37.1
6.4
6.5
12.3
12.1
1.0
1.0
8.2
7.6
1.7
1.4
zOthers
Abbott India
Neutral
4,681
-
9,947
3,153
3,583
14.1
14.4
152.2
182.7
30.8
25.6
151.0
129.0
25.6
26.1
2.9
2.5
Bajaj Electricals
Buy
259
306
2,615
5,099
5,805
5.6
5.9
11.4
14.6
22.8
17.8
3.0
2.7
13.4
15.1
0.5
0.5
Finolex Cables
Neutral
439
-
6,717
2,883
3,115
12.0
12.1
14.2
18.6
30.9
23.6
16.5
14.4
15.8
14.6
2.0
1.8
Goodyear India*
Neutral
773
-
1,783
1,598
1,704
10.4
10.2
49.4
52.6
15.6
14.7
72.2
63.4
18.2
17.0
0.8
113.6
Hitachi
Neutral
1,523
-
4,142
2,081
2,433
8.8
8.9
33.4
39.9
45.6
38.2
36.8
30.7
22.1
21.4
2.0
1.7
Jyothy Laboratories
Neutral
355
-
6,449
1,440
2,052
11.5
13.0
8.5
10.0
41.8
35.5
10.1
9.4
18.6
19.3
4.8
3.3
Page Industries
Neutral
16,718
-
18,647
2,450
3,124
20.1
17.6
299.0
310.0
55.9
53.9
372.3
284.2
47.1
87.5
7.7
6.0
Relaxo Footwears
Neutral
430
-
5,166
2,085
2,469
9.2
8.2
7.6
8.0
56.9
54.2
22.1
18.8
17.9
18.8
2.6
2.2
Siyaram Silk Mills
Accumulate
1,518
1,714
1,423
1,799
2,040
11.6
11.7
104.9
122.4
14.5
12.4
2.4
2.0
16.4
16.4
1.0
0.9
Styrolution ABS India*
Neutral
637
-
1,120
1,440
1,537
9.2
9.0
40.6
42.6
15.7
14.9
40.0
36.4
12.3
11.6
0.8
0.7
TVS Srichakra
Neutral
3,768
-
2,885
2,304
2,614
13.7
13.8
231.1
266.6
16.3
14.1
423.4
333.4
33.9
29.3
1.3
1.1
HSIL
Neutral
353
-
2,550
2,384
2,515
15.8
16.3
15.3
19.4
23.1
18.2
22.9
19.7
7.8
9.3
1.2
1.1
Kirloskar Engines India
Neutral
345
-
4,995
2,554
2,800
9.9
10.0
10.5
12.1
32.9
28.6
13.8
13.0
10.7
11.7
1.6
1.4
Ltd
M M Forgings
Neutral
446
-
538
546
608
20.4
20.7
41.3
48.7
10.8
9.1
61.0
54.0
16.6
17.0
0.8
0.8
Banco Products (India)
Neutral
227
-
1,623
1,353
1,471
12.3
12.4
14.5
16.3
15.7
13.9
21.6
19.5
14.5
14.6
1.1
122.9
Competent Automobiles Neutral
210
-
129
1,137
1,256
3.1
2.7
28.0
23.6
7.5
8.9
40.4
36.5
14.3
11.5
0.1
0.1
Stock Watch
October 27, 2016
Company Name
Reco
CMP
Target
Mkt Cap
Sales ( Čcr )
OPM(%)
EPS (Č)
PER(x)
P/BV(x)
RoE(%)
EV/Sales(x)
(Č)
Price ( Č)
( Č cr )
FY17E
FY18E
FY17E
FY18E
FY17E
FY18E
FY17E
FY18E
FY17E
FY18E
FY17E
FY18E
FY17E
FY18E
zOthers
Nilkamal
Neutral
1,718
-
2,564
1,995
2,165
10.7
10.4
69.8
80.6
24.6
21.3
98.2
85.3
16.6
16.5
1.3
1.2
Visaka Industries
Neutral
223
-
354
1,051
1,138
10.3
10.4
21.0
23.1
10.6
9.6
28.5
26.7
9.0
9.2
0.6
0.6
Transport Corporation of
Neutral
184
-
1,406
2,671
2,911
8.5
8.8
13.9
15.7
13.3
11.7
1.8
1.6
13.7
13.8
0.6
0.6
India
Elecon Engineering
Neutral
67
-
727
1,482
1,660
13.7
14.5
3.9
5.8
17.1
11.5
4.0
3.7
7.8
10.9
0.8
0.7
Surya Roshni
Neutral
239
-
1,047
3,342
3,625
7.8
7.5
17.3
19.8
13.8
12.1
26.2
21.1
10.5
10.8
0.6
0.5
MT Educare
Neutral
140
-
557
366
417
17.7
18.2
9.4
10.8
14.9
13.0
3.3
2.9
22.2
22.3
1.4
1.2
Radico Khaitan
Neutral
139
-
1,849
1,659
1,802
13.0
13.2
6.3
7.4
21.9
18.8
1.9
1.8
8.6
9.3
1.5
1.4
Garware Wall Ropes
Neutral
543
-
1,187
873
938
12.9
13.1
30.9
34.9
17.6
15.5
2.8
2.4
15.7
15.2
1.3
1.2
Wonderla Holidays
Neutral
403
-
2,274
287
355
38.0
40.0
11.3
14.2
35.6
28.4
5.1
4.5
21.4
23.9
7.7
6.2
Linc Pen & Plastics
Neutral
260
-
385
382
420
9.3
9.5
13.5
15.7
19.3
16.6
3.3
2.9
17.1
17.3
1.1
1.0
The Byke Hospitality
Neutral
182
-
730
287
384
20.5
20.5
7.6
10.7
24.0
17.0
5.0
4.0
20.7
23.5
2.6
1.9
Interglobe Aviation
Neutral
932
-
33,571
21,122
26,005
14.5
27.6
110.7
132.1
8.4
7.1
50.4
36.0
168.5
201.1
1.6
1.2
Coffee Day Enterprises
Neutral
223
-
4,594
2,964
3,260
20.5
21.2
4.7
8.0
-
27.9
2.6
2.4
5.5
8.5
2.0
1.7
Ltd
Navneet Education
Neutral
110
-
2,618
1,062
1,147
24.0
24.0
6.1
6.6
18.0
16.6
3.7
3.3
20.6
19.8
2.5
2.3
Navkar Corporation
Buy
196
265
2,795
408
612
42.9
42.3
6.8
11.5
28.9
17.0
2.0
1.8
6.9
10.5
7.9
5.3
UFO Moviez
Neutral
461
-
1,272
619
685
33.2
33.4
30.0
34.9
15.4
13.2
2.1
1.8
13.8
13.9
1.7
1.4
VRL Logistics
Neutral
314
-
2,862
1,902
2,119
16.7
16.6
14.6
16.8
21.5
18.6
4.7
4.1
21.9
22.2
1.6
1.4
Team Lease Serv.
Neutral
1,025
-
1,752
3,229
4,001
1.5
1.8
22.8
32.8
45.0
31.2
4.8
4.2
10.7
13.4
0.4
0.3
S H Kelkar & Co.
Neutral
305
-
4,409
1,036
1,160
15.1
15.0
6.1
7.2
49.9
42.5
5.3
4.9
10.7
11.5
4.2
3.7
Quick Heal
Neutral
251
-
1,755
408
495
27.3
27.0
7.7
8.8
32.4
28.5
3.0
3.0
9.3
10.6
3.5
2.9
Narayana Hrudaya
Neutral
357
-
7,292
1,873
2,166
11.5
11.7
2.6
4.0
134.9
90.0
8.3
7.5
6.1
8.3
4.0
3.5
Manpasand Bever.
Neutral
724
-
4,140
836
1,087
19.6
19.4
16.9
23.8
42.9
30.4
5.1
4.5
12.0
14.8
4.7
3.5
Parag Milk Foods
Neutral
308
-
2,593
1,919
2,231
9.3
9.6
9.5
12.9
32.6
23.8
5.1
4.2
15.5
17.5
1.5
1.3
Mirza International
Buy
94
113
1,130
1,024
1,148
18.0
18.0
6.9
8.0
13.6
11.7
2.3
1.9
16.6
16.2
1.3
1.1
Asian Granito
Buy
274
351
825
1,118
1,220
11.8
12.0
13.0
16.0
21.1
17.2
2.1
1.8
9.7
10.7
1.0
0.9
Source: Company, Angel Research; Note: *December year end; #September year end; &October year end; Price as on October 26, 2016
Market Outlook
October 27, 2016
Research Team Tel: 022 - 39357800
DISCLAIMER
Angel Broking Private Limited (hereinafter referred to as “Angel”) is a registered Member of National Stock Exchange of India
Limited,Bombay Stock Exchange Limited and Metropolitan Stock Exchange Limited. It is also registered as a Depository Participant with
CDSL and Portfolio Manager with SEBI. It also has registration with AMFI as a Mutual Fund Distributor. Angel Broking Private Limited is a
registered entity with SEBI for Research Analyst in terms of SEBI (Research Analyst) Regulations, 2014 vide registration number
INH000000164. Angel or its associates has not been debarred/ suspended by SEBI or any other regulatory authority for accessing
/dealing in securities Market. Angel or its associates/analyst has not received any compensation / managed or
co-managed public offering of securities of the company covered by Analyst during the past twelve months.
This document is solely for the personal information of the recipient, and must not be singularly used as the basis of any investment
decision. Nothing in this document should be construed as investment or financial advice. Each recipient of this document should make
such investigations as they deem necessary to arrive at an independent evaluation of an investment in the securities of the companies
referred to in this document (including the merits and risks involved), and should consult their own advisors to determine the merits and
risks of such an investment.
Reports based on technical and derivative analysis center on studying charts of a stock's price movement, outstanding positions and
trading volume, as opposed to focusing on a company's fundamentals and, as such, may not match with a report on a company's
fundamentals. Investors are advised to refer the Fundamental and Technical Research Reports available on our website to evaluate the
contrary view, if any.
The information in this document has been printed on the basis of publicly available information, internal data and other reliable
sources believed to be true, but we do not represent that it is accurate or complete and it should not be relied on as such, as this
document is for general guidance only. Angel Broking Pvt. Limited or any of its affiliates/ group companies shall not be in any way
responsible for any loss or damage that may arise to any person from any inadvertent error in the information contained in this report.
Angel Broking Pvt. Limited has not independently verified all the information contained within this document. Accordingly, we cannot
testify, nor make any representation or warranty, express or implied, to the accuracy, contents or data contained within this document.
While Angel Broking Pvt. Limited endeavors to update on a reasonable basis the information discussed in this material, there may be
regulatory, compliance, or other reasons that prevent us from doing so.
This document is being supplied to you solely for your information, and its contents, information or data may not be reproduced,
redistributed or passed on, directly or indirectly.
Neither Angel Broking Pvt. Limited, nor its directors, employees or affiliates shall be liable for any loss or damage that may arise from
or in connection with the use of this information.